

Kauser Kanji
VOD Pro
Share
Lies, damned lies, statistics. That was my abiding thought while digesting Ofcom’s latest Media Nations Report (2025) this week.
I don’t fundamentally doubt the numbers – well, actually, I sort of do. The issue isn’t necessarily the data itself, but the methodology. We’re comparing apples with kumquats. And even then, only some apples with some kumquats.
We’ll come to that – and to addressing the title of this piece: the forecasted end of broadcast television.
But first, a few highlights.
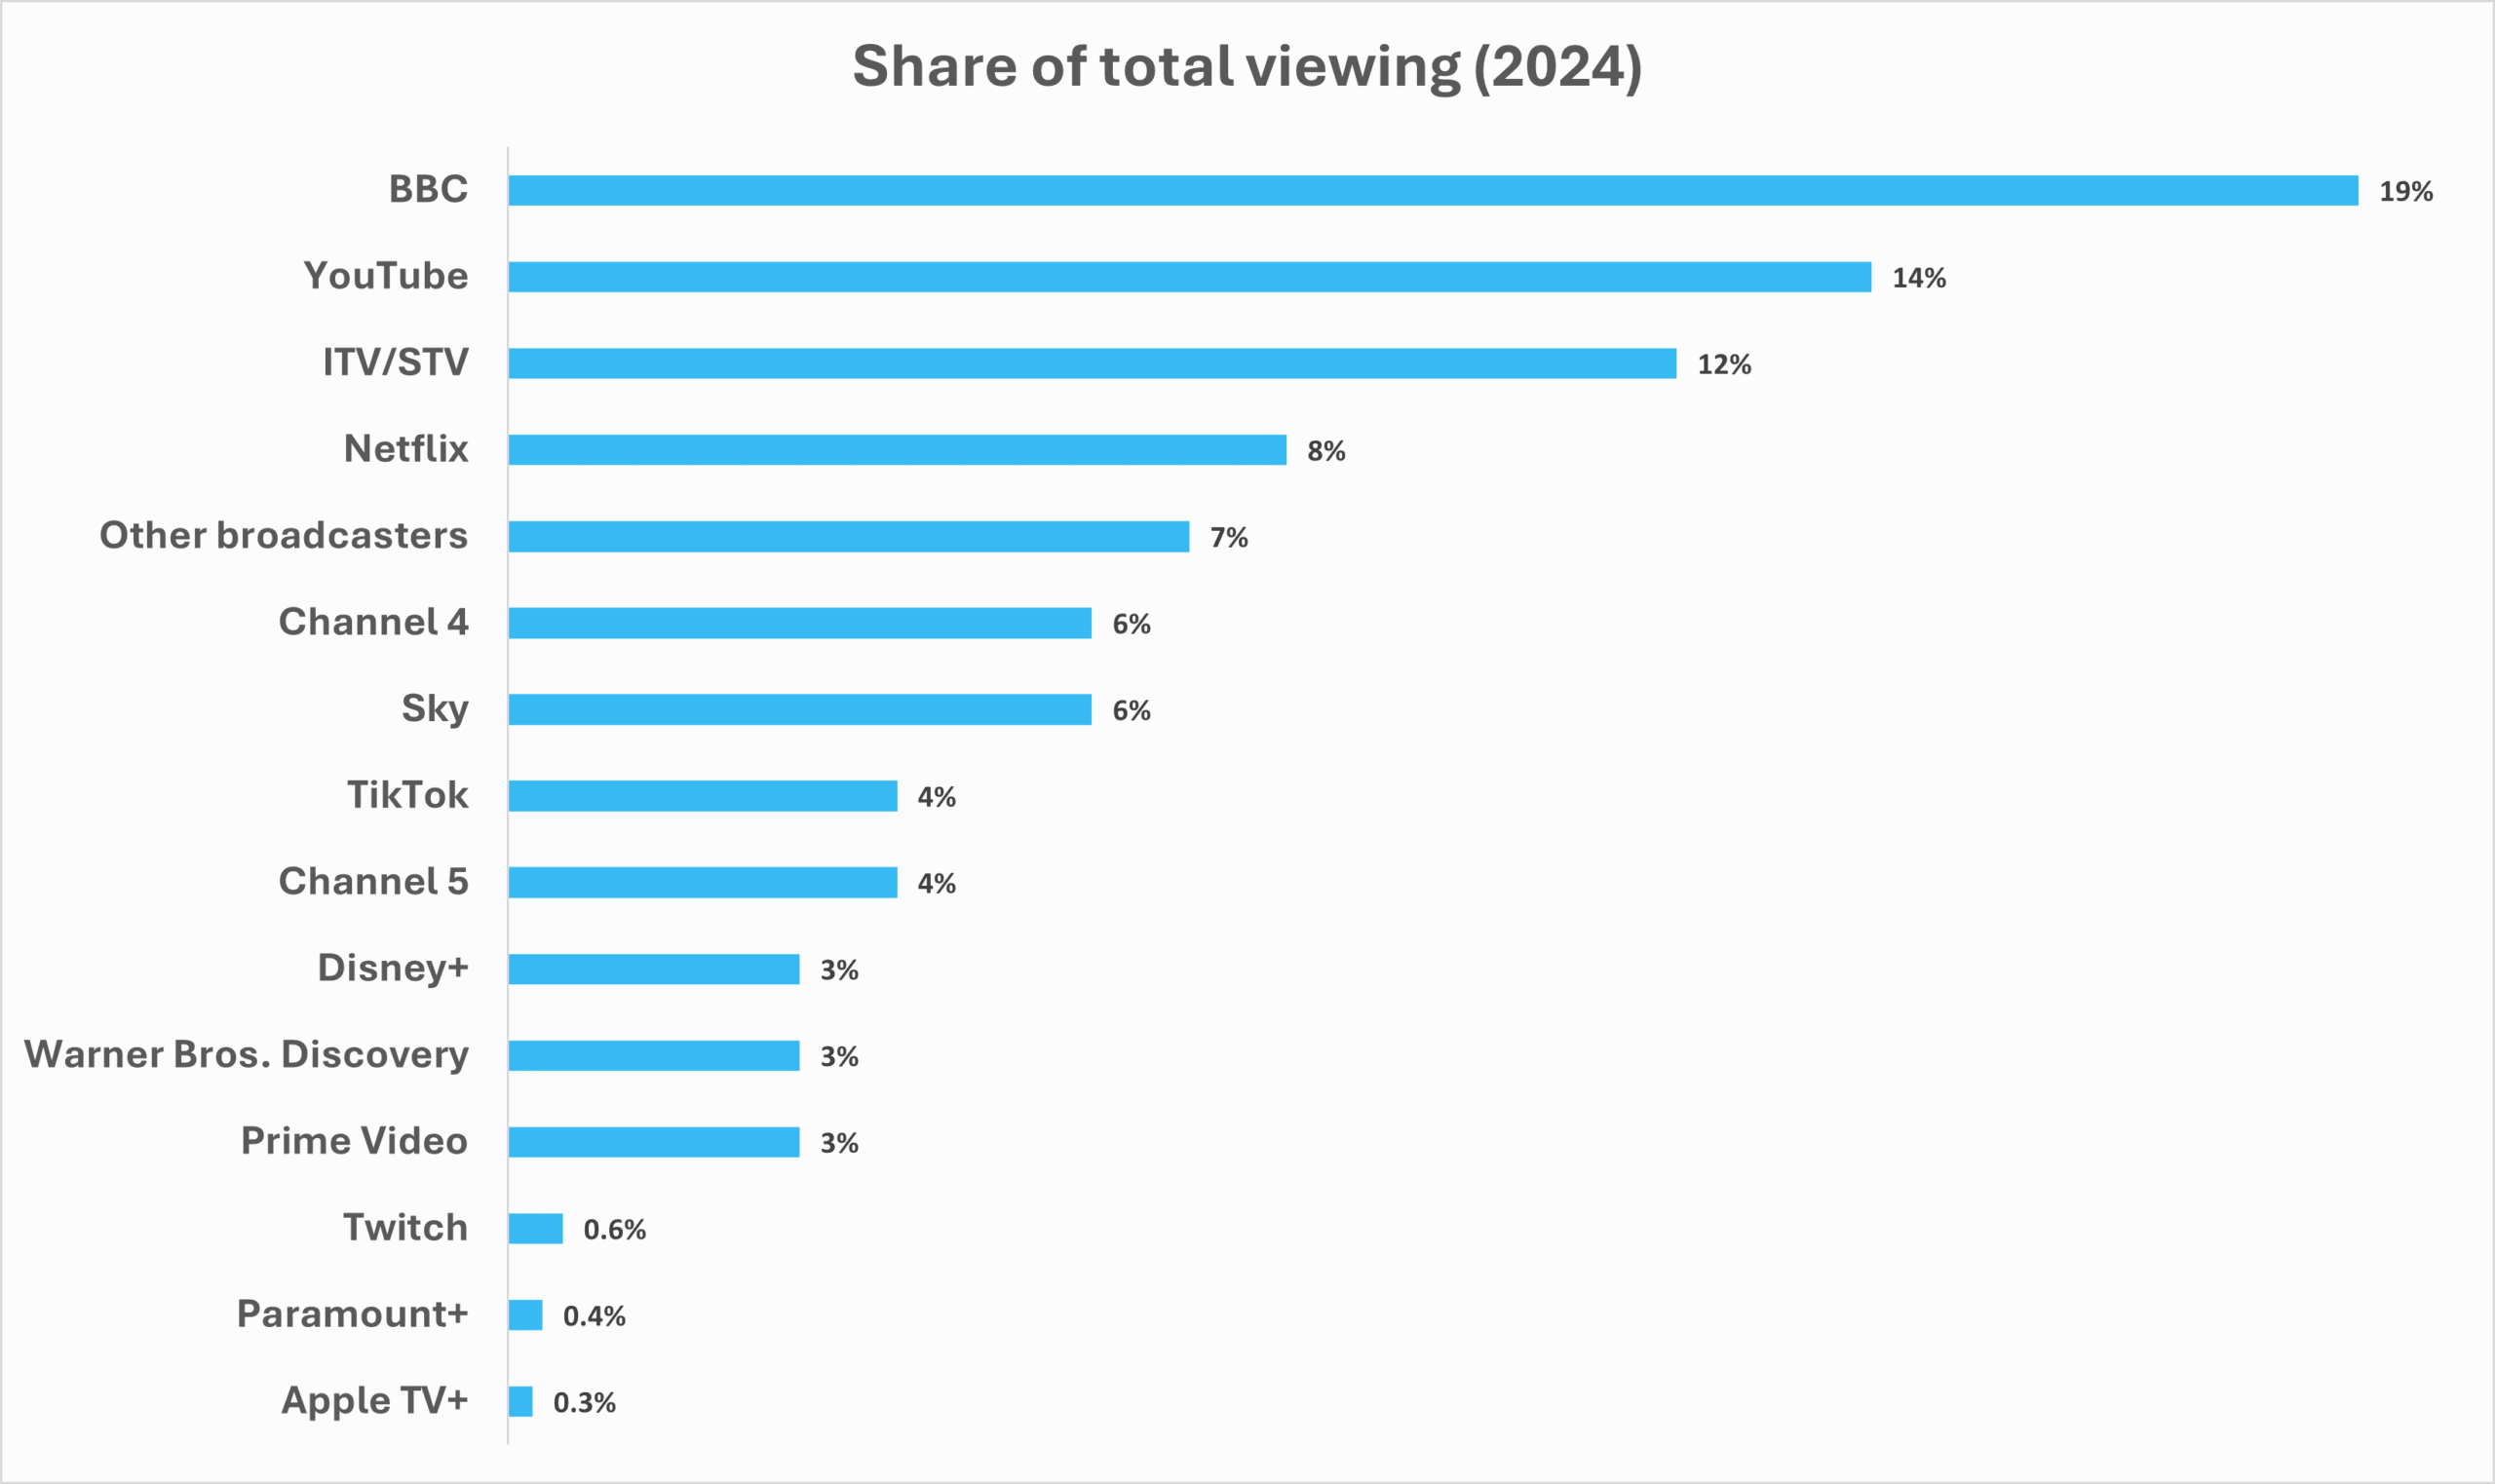
#1. YouTube > ITV
The headline stat (at least for the national press) is that YouTube has overtaken ITV as the second most-watched “TV” service in the UK.
The data is fascinating.
Purely in percentage terms, BBC channels – linear and BVOD – account for 19% of the total share of viewing in 2024. YouTube, in second, is at 14% followed by ITV at 12%. Netflix comes in at fourth ahead of Channel 4 and Sky.
#2. Minutes Viewed
With a bit of digging, calculating and extrapolating, we can convert the viewing share into daily minutes viewed. (For broadcasters in the chart below, this includes linear, BVOD and recorded viewing.)
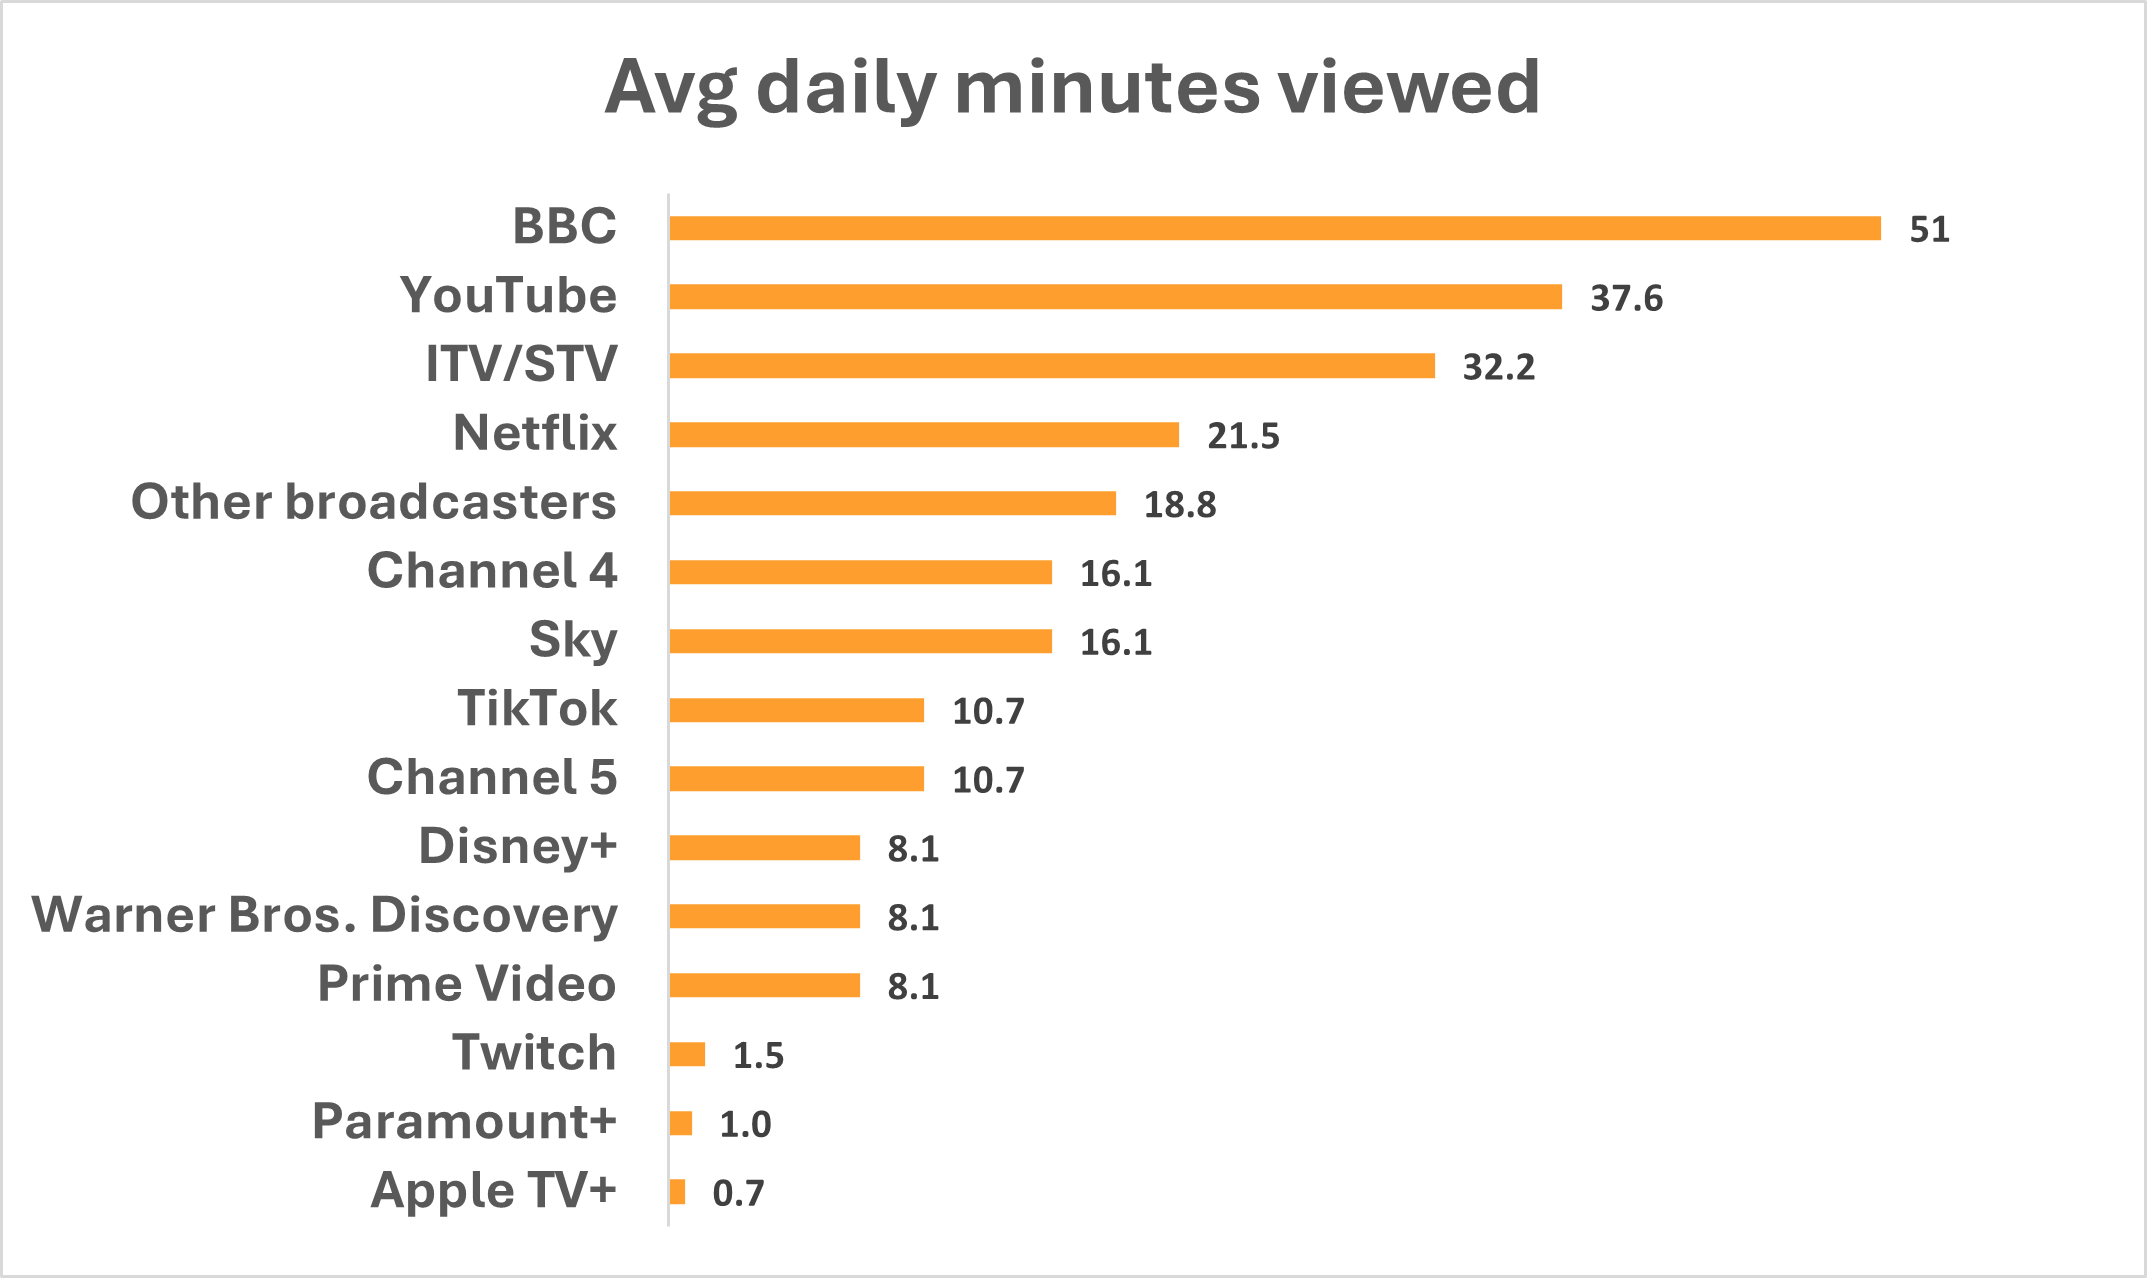
YouTube is watched for 38 minutes a day (39 mins according to the report). TikTok – which I finally downloaded this week and immediately muted after three push notifications in an hour – gets 11 minutes a day. That’s more than Disney+, Prime Video, or WBD.
#3. A Response from Thinkbox
Lindsey Clay, CEO of Thinkbox – the marketing body for commercial TV in the UK – responded with a robust defence of TV. The key points:
- TV is 85% of AV advertising time; YouTube is 11.1%
- The heaviest 25% of YouTube viewers account for nearly 90% of its viewing. The other 75% of the population watch YouTube for 5 mins a day.
- Kids watch loads more TV than YouTube
- YouTube isn’t TV (“TV is a high-quality, trusted form of video content. YouTube is a platform where anyone can upload anything. So no, YouTube isn’t TV. But TV is increasingly on YouTube, meeting viewers where they are.”
- TV delivers a far greater average profit ROI than online video (£5.61 vs. £3.86)
- TV is still the home of big cultural moments
#4. Ofcom / BARB Methodology
Ofcom’s report pulls heavily from BARB data, which is based on ~7,000 UK households (16,000 individuals). That’s standard industry practice but still a relatively small panel. Is it representative?
BARB does supplement panel data with device-based census data, especially for BVOD on smartphones, tablets, and PCs. But it admits that:
“Device-based data cannot tell us the number of people watching or who they are… For this, we need the BARB panel.”
So, even the enhanced methodology has limits.
#5. And talking of BVOD
The table inside the chart is interesting here. It shows the percentage increase in broadcaster’s content viewed OTT rather than live.
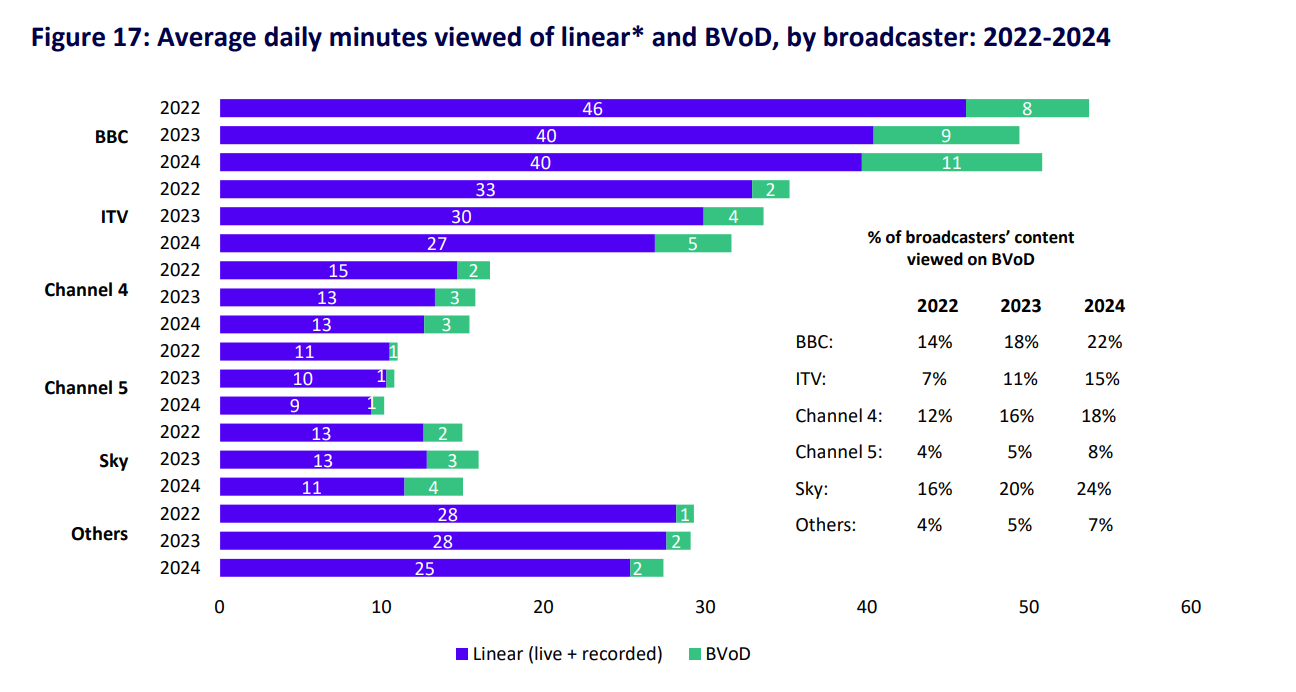
The problem, of course, is that the BVOD growth isn’t enough to counter the ongoing decline in linear viewing or, by extension, advertising revenues.
#6. Attention Competition vs. TV
Using data from the IPA’s TouchPoints study (sample size: 6,416 UK adults aged 15+), Ofcom charts how people are spending their time across media and other activities.
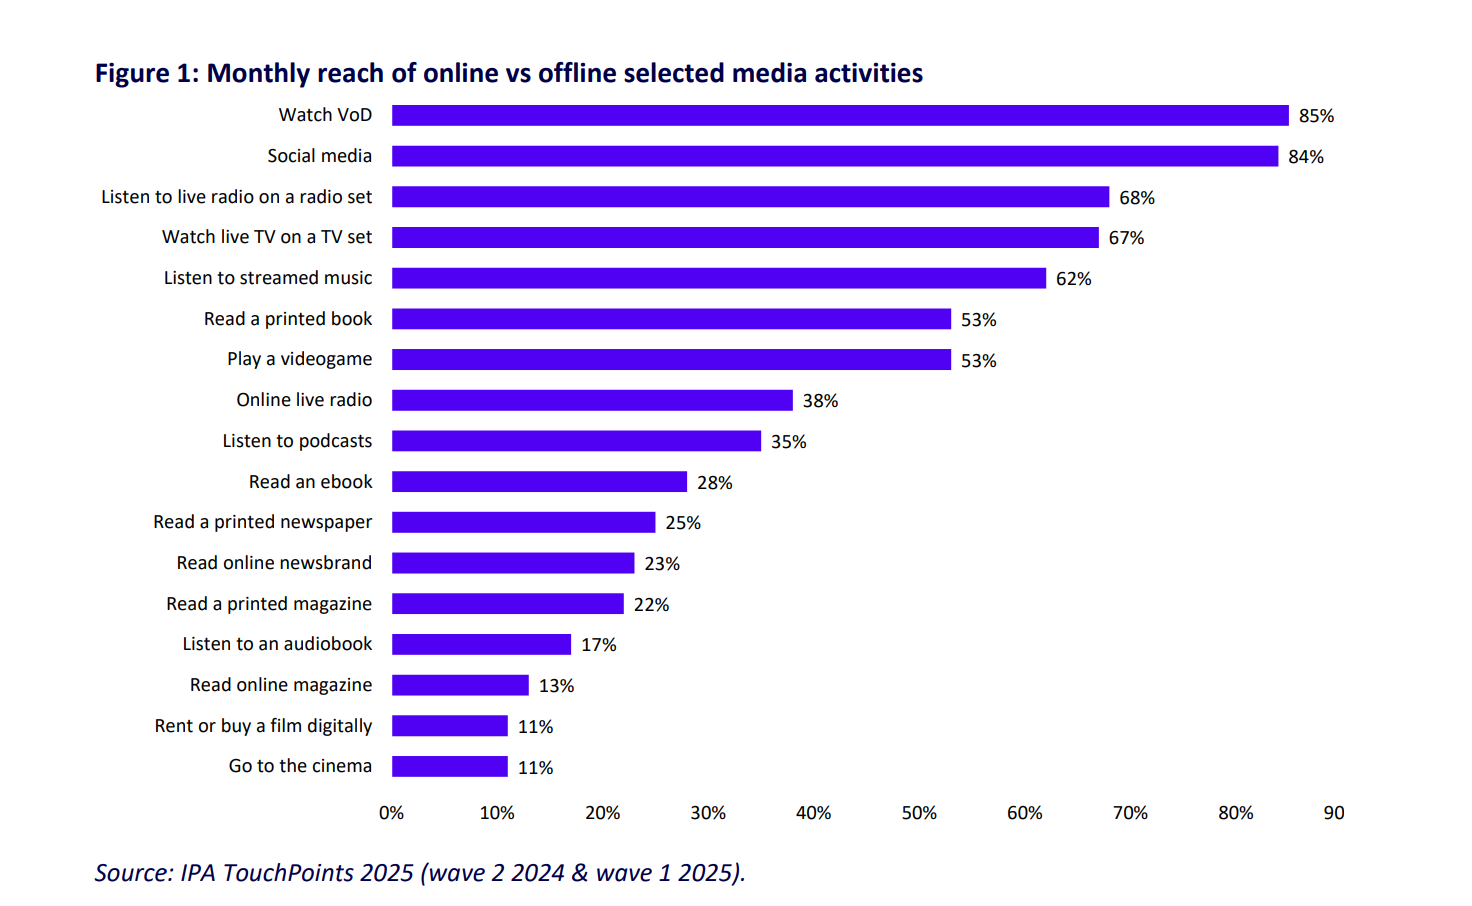
The good news? TV – made up of “Watch VOD” (85%) and “Watch Live TV on a TV set” (67%) still dominates leisure-time.
The bad news? The model seems… optimistic. Do 53% of us really still read printed books, for example? And when compared with BARB data – which suggests people are watching 270 minutes of TV a day on top of all the other listed activities – it starts to look unrealistic.
I’ll double-check the numbers, speak to a few people (including Ofcom), and report back.
#7. The End of Broadcast TV (apparently)
Ofcom uses the words “decline” or “declining” 86 times in the 94 page report. Fair enough – we are in a transition phase from TV to OTT after all.
But the line that caught my eye was “Broadcast TV viewing continued its long-term decline in 2024”.
Based on BARB data, that’s accurate. Since 2017, total broadcast content (live, BVOD, and recorded) has fallen from 71% to 55.6% of total viewing – a 15.4% drop over seven years. That’s a 2.21% annual decline on average.
Projecting that forward, we get:
- Broadcast content makes for less than 50% viewing for the first time in 2027 (49.4%)
- 2032: under 40%
- 2036: under 30%
- 2041: under 20%
- 2045: under 10% (at which point the game is effectively over)
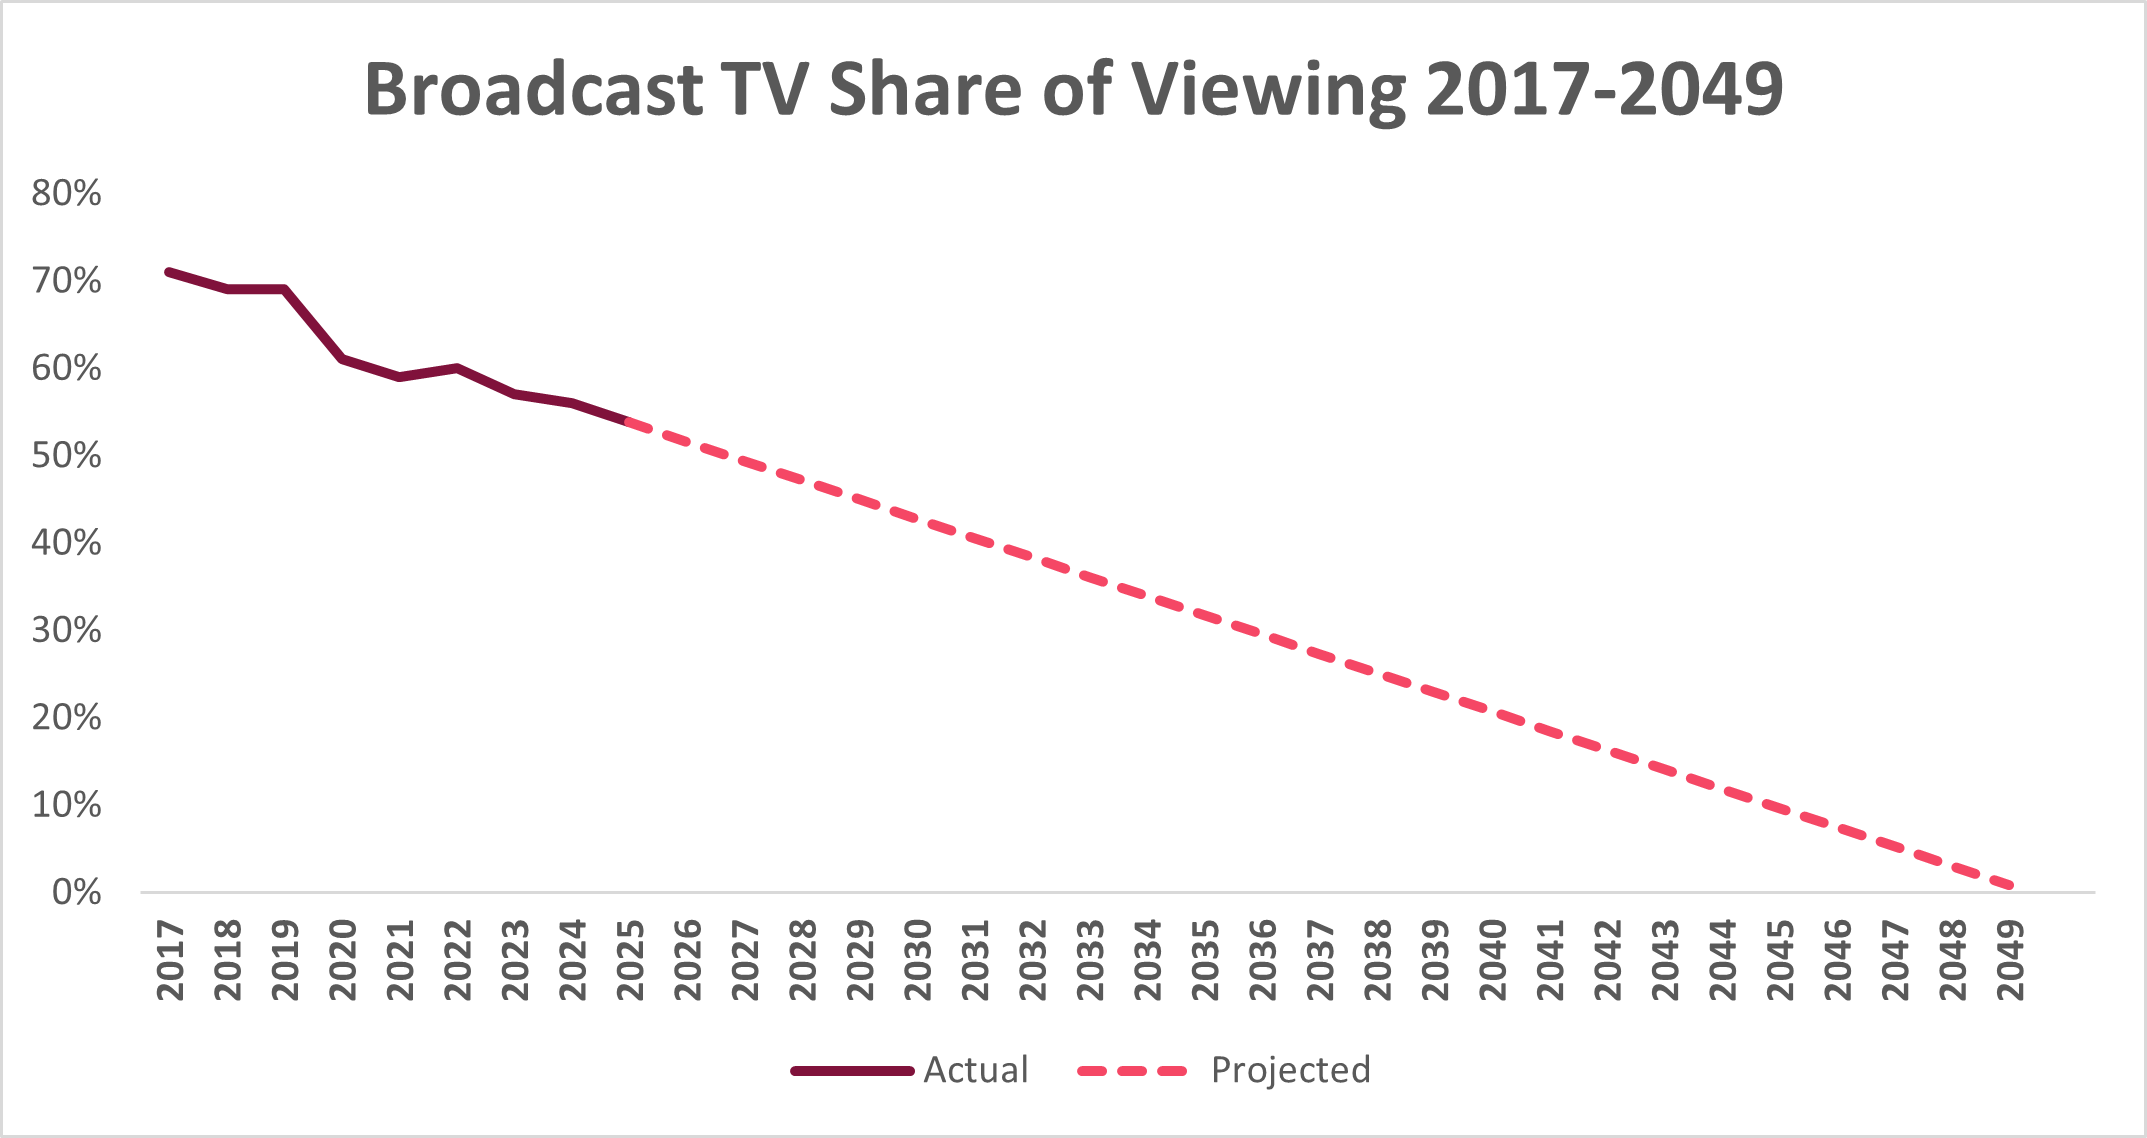
Caveats? Many.
This model assumes a steady, linear decline, which is unlikely. It doesn’t account for:
- New technology that accelerates or slows the shift (e.g. true immersive, “Ready Player One” type VR, better aggregation, AI-supercharged personalisation, universal UX)
- The circle of life: older linear viewers passing away; younger ones not adopting “traditional TV”
- Unpredictable shocks (e.g. another pandemic)
And anyway, broadcast TV won’t ever truly die out. People once thought that radio would vanish when television came along. It didn’t – it just found a new role. If we’re splitting hairs, yes, “broadcast” TV might cease to exist as we move to IP-only delivery but the format itself (scheduled, shared viewing) will persist, repackaged under a different label.
Thoughts? DM me on LinkedIn.
ABOUT KAUSER KANJI
Kauser Kanji has been working in online video for 20 years, formerly at Virgin Media and NBC Universal, and founded VOD Professional in 2011. He has since completed major OTT projects for, amongst others, A+E Networks, the BBC, BBC Studios, Channel 4, DR (Denmark), Liberty Global, Netflix, Sony Pictures, the Swiss Broadcasting Corporation and UKTV. He now writes industry analyses, hosts an online debate show, OTT Question Time, as well as its in-person sister event, OTT Question Time Live.